29.09.2025 aktualisiert

verifiziert
Premiumkunde
100 % verfügbarMicrosoft Fabric | Power BI - Data Pipeline Automation and BI Expert
Hyderabad, Indien BE in Computer Science, Microsoft Certified Professional
Über mich
Hello! I'm Madhusudan, a Microsoft Certified Fabric Data Engineer (DP-700) & Power BI Analyst (PL-300) with 15+ yrs experience. I build scalable Fabric pipelines, automate data ingestion, and design interactive Power BI dashboards to help businesses turn raw data into insights.
Skills
Sql Server Data Tools (SSDT)Sql Data WarehouseData AnalysisArchitekturAutomatisierungMicrosoft AzureBusiness IntelligenceData TransformationData WarehousingPower BiAzure Data LakeSQLDatenaufnahmeAzure Data FactoryData Lake
Tired of raw CSV files and scattered data? I help businesses transform their complex data into clear, interactive, and insightful Power BI dashboards that drive decision-making.
With over 10 years of experience in the data analytics field, I specialize in building robust, end-to-end business intelligence solutions on the Microsoft Azure platform. My core expertise lies in implementing the Medallion Architecture using Microsoft Fabric, ensuring your data is clean, reliable, and perfectly structured for analysis.
How I can help you:
1. Engaging Power BI Dashboards: I don't just build reports; I create compelling and intuitive visualizations that tell a story and provide actionable insights at a glance.
2. End-to-End Microsoft Fabric Implementation: From data ingestion with Data Factory to modeling and reporting, I can build your entire analytics pipeline from the ground up.
3. Data Transformation & Modeling: I'll turn your messy CSVs and other data sources into a pristine "Gold" layer, ready for accurate analysis using tools like Azure Synapse and SQL.
4. Performance Optimization: Ensuring your reports are fast, responsive, and reliable for a smooth user experience.
Sprachen
Englishverhandlungssicher
Projekthistorie
Implemented Medallion Architecture (Bronze, Silver, Gold) in Microsoft Fabric for a manufacturing firm. Designed scalable pipelines to integrate multi-source data, applied cleaning & transformation, and delivered analytics-ready datasets. Improved reporting speed, data quality & operational insights. Key Skills/Tags: Microsoft Fabric, Medallion Architecture, Data Engineering, Power BI, ETL Pipelines, Data Modeling, Azure, Manufacturing Analytics
We created the Sales Performance Report using Power BI. This report provides a comprehensive analysis of your company's sales data, offering key insights to drive strategic decision-making and boost overall sales effectiveness. Purpose of the Report The Sales Performance Report aims to: Track Sales Metrics: Monitor critical sales metrics and key performance indicators (KPIs). Analyze Trends: Identify sales trends over different time periods. Evaluate Sales Channels: Assess the performance of various sales channels and regions.
Portfolio
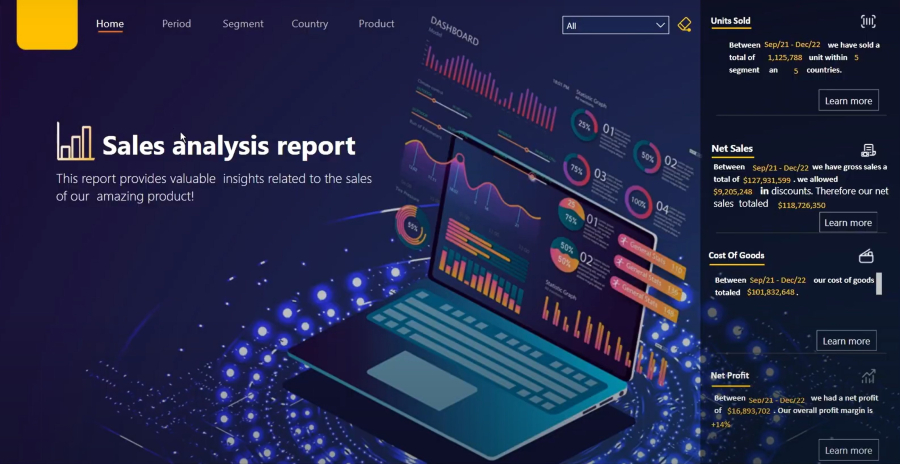
Sales Dashboard
Efficiently visualizing sales data is crucial for informed decision-making. Check out this live sales report data transformed from an Excel sheet into an insightful Power BI dashboard
https://www.youtube.com/watch?v=ek13y9mPaaA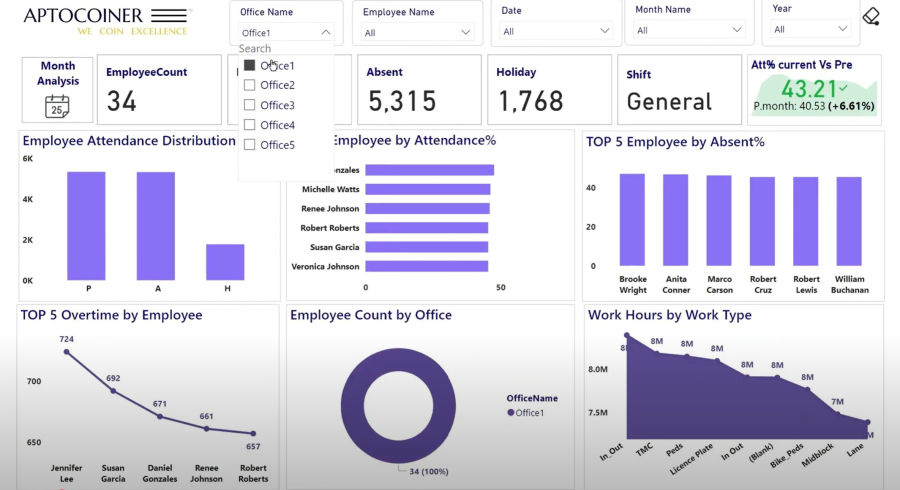
Employee Dashboard
Measure and improve workforce productivity with our Power BI Employee Performance Dashboard! Track KPIs, performance ratings, attendance, and goal achievements to make data-driven HR decisions. Ideal for HR managers
https://www.youtube.com/watch?v=q-YPATC1oco
Restaurant Analytics
Unlock Your Restaurant's Potential with Advanced Analytics and Reporting In the competitive restaurant industry, making informed decisions is the key to success. Gut feelings are no longer enough. With our advanced Restaurant Analytics and Reporting dashboard, you can transform your raw sales data into actionable insights, helping you boost profitability, optimize your menu, and understand your customers like never before.
https://www.youtube.com/watch?v=A6Vdd9nr75w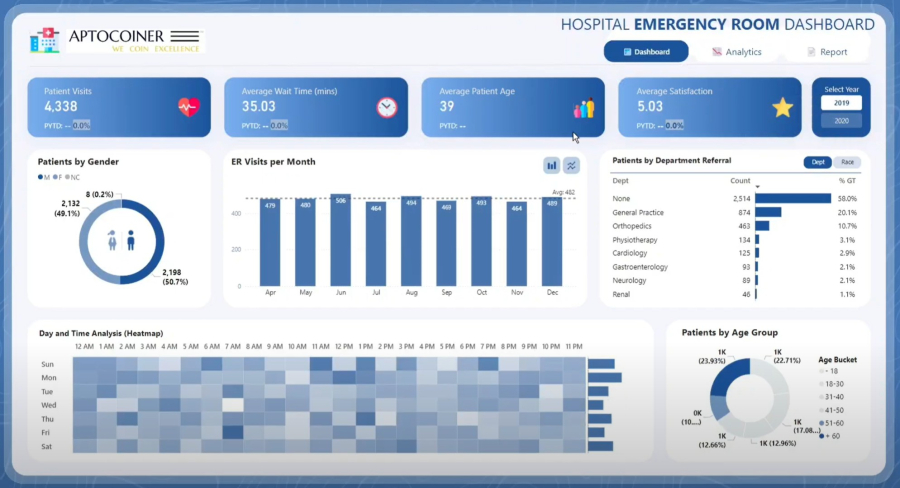
Hospital Emergency
Optimize emergency room operations with our Power BI Hospital Emergency Room Dashboard! Get real-time insights on patient flow, wait times, bed occupancy, and critical care needs.
https://www.youtube.com/watch?v=mKfLIrk62Hc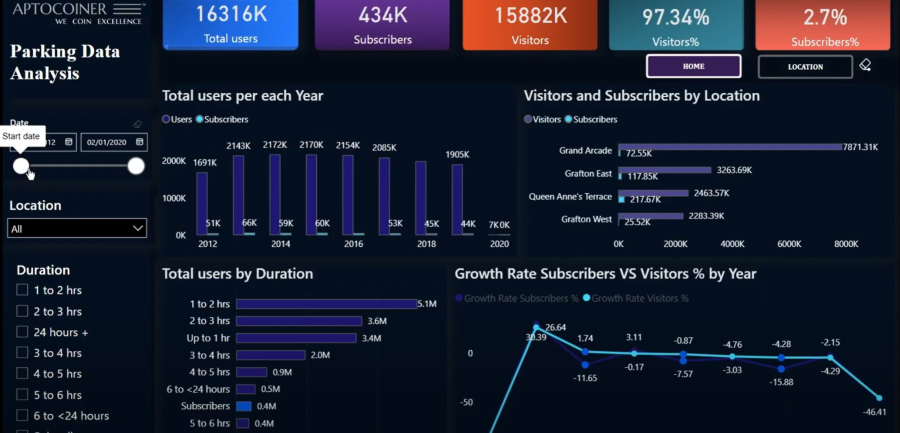
Parking Analysis
Optimize parking management with our Power BI Parking Analysis Report! Monitor occupancy rates, peak hours, revenue, and space utilization to enhance efficiency and planning.
https://www.youtube.com/watch?v=2I_AzMYtHh0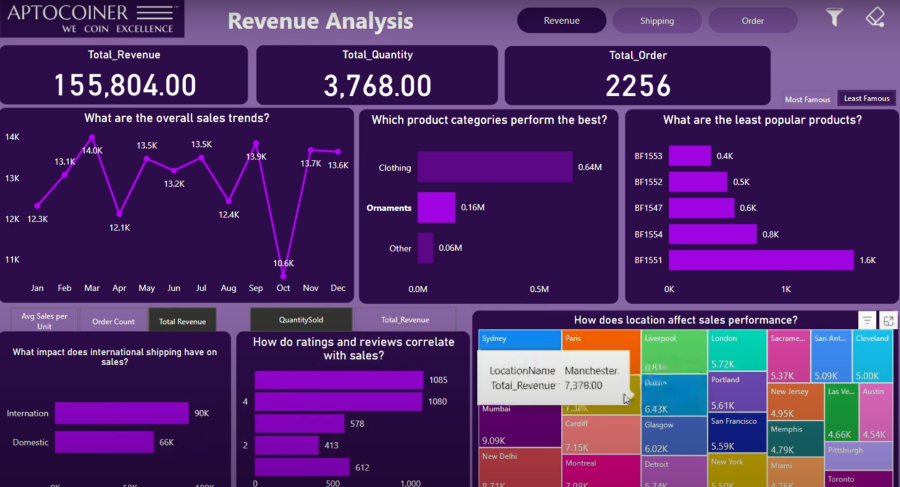
Merchandise Sales
Unlock Retail Success with Our Power BI Merchandise Sales Analysis Dashboard! Merchandise Sales Analysis with Power BI – Real-Time Retail Insights Optimize your retail performance with our Power BI dashboard. Track sales, stock movement, and top-selling products in real time to drive smart, data-backed decisions.
https://www.youtube.com/watch?v=g-G0mbUY1zc